January 19th 2024
It’s time to take a look at the state of COVID in the United States through one simple variable, the weekly death count. When the pandemic started I did some work to track the death count and you can find my old pandemic pages at https://mwaugh.com/pages/pandemic.shtml. At the time the reporting on the state of the pandemic was very confused, and a number of private teams set up web pages to track various statistics.
I did not have a lot of trust in the “COVID Death” data being reported. It seemed to me that overworked medical professionals were likely over-reporting COVID deaths. If anyone under their care died of any respiratory issue, especially if they tested positive for COVID before or after death, it would be easy to assign it to COVID, who was going to ask any questions about quality of care etc., when we were in the middle of a pandemic. There was one very interesting statistic that seemed I could work with. Since 2015 through 2019 the weekly death rate had remained fairly constant and each year had tracked with appropriate seasonal adjustments each week. So if there was a significant variance in weekly deaths from 2020 then it seemed likely that these excess deaths could be attributed to COVID.
I’ve updated my weekly graph for 2015 through 2023.
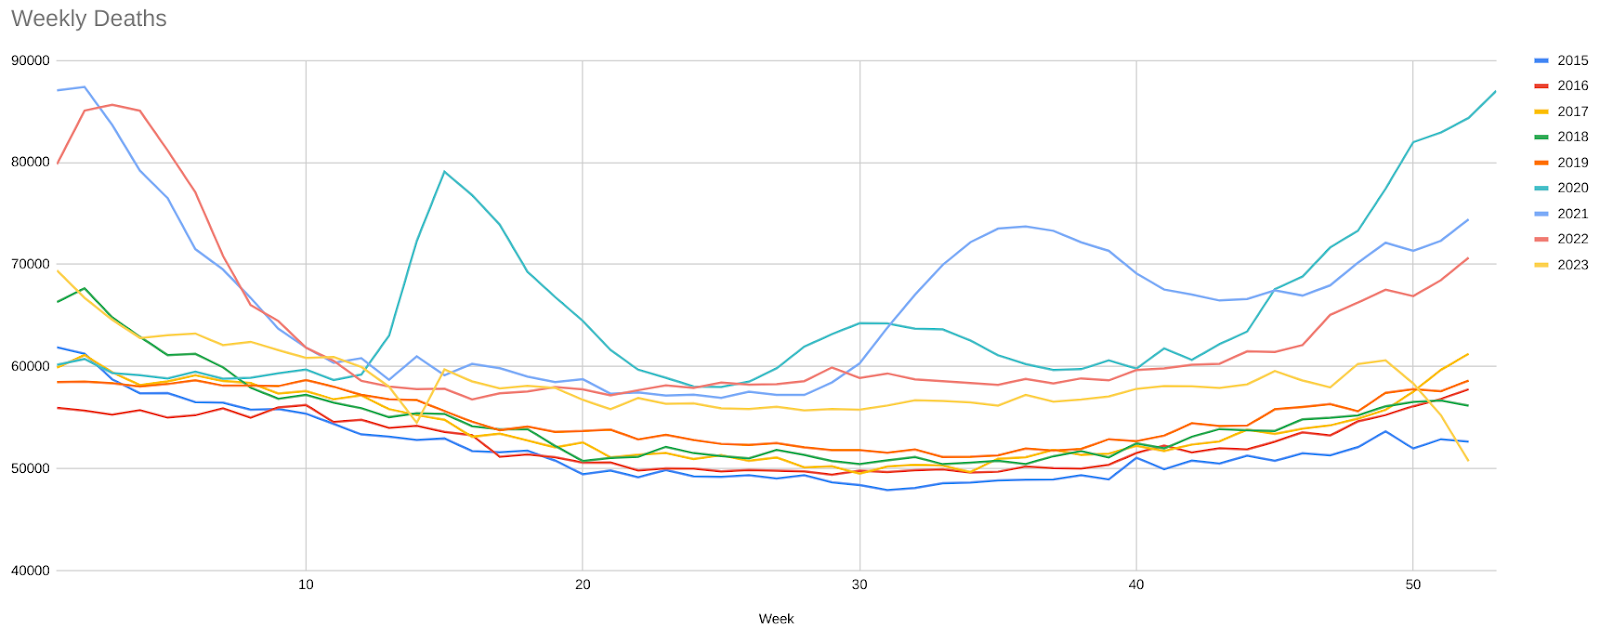
You can see the 2015 through 2019 numbers lower and basically following each other week by week. In 2020 you can see the huge jump in deaths at the start of the year and in the March/April period. The graph also tells the story of 2020, the worst year, then 2021 and 2022 reducing but still significant deaths and now in 2023 there are still a significant number of excess deaths but the numbers over the past 3 years have been returning to normal.
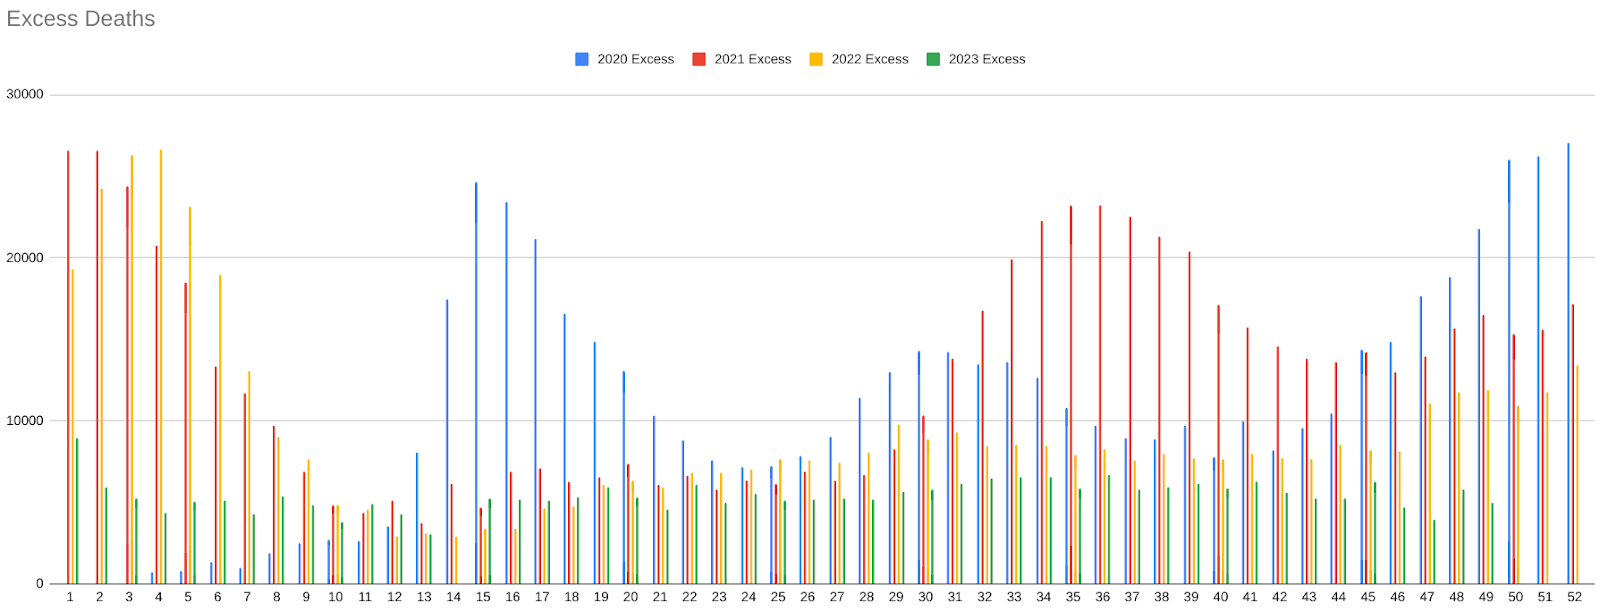
The next graph is a little difficult to read, but it uses the average number of deaths per week for 2015-2019 and then calculates the excess deaths per week for 2020-2023. Again, this graph shows the number of excess deaths reducing year over year, except for around the third quarter of 2021 which exceeded 2020.
So where are we? Obviously COVID is still around, there is no other obvious explanation for these excess deaths. While infections may be up, some data seems to indicate this, and the wastewater tracking appears to confirm this, the number of deaths is subsiding. How to explain this reduction in deaths? It could be that the especially vulnerable have already been removed from the population or it may be that vaccination has been effective. Likely it’s mostly infections, but some of it can probably be attributed to a reduction in the size of the vulnerable population.